A) Country I has the most unequal income distribution.
B) Country III has the most equal income distribution.
C) Country II has the most unequal income distribution.
D) Country II has the most equal income distribution.
E) Country III has a more equal income distribution than Country II.
G) A) and B)
Correct Answer

verified
Correct Answer
verified
Multiple Choice
Some people believe that employees should be paid the same wages when their jobs, although different, require similar levels of education, training, experience, and responsibility. This principle is known as:
A) the equal-pay-for-equal work doctrine.
B) Lorenz equivalence.
C) marginal productivity theory.
D) comparable worth.
F) B) and C)
Correct Answer

verified
Correct Answer
verified
True/False
Medicaid is an example of a cash assistance poverty program.
B) False
Correct Answer

verified
Correct Answer
verified
True/False
Discrimination lowers the average wage of members of one group of workers in spite of laws that require equal pay for all workers.
B) False
Correct Answer

verified
Correct Answer
verified
Multiple Choice
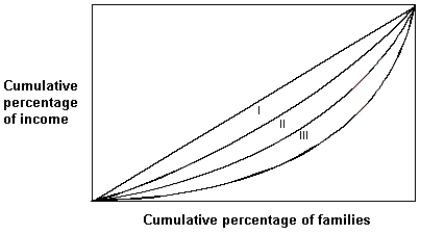
Exhibit 12-6 Lorenz curves  -Exhibit 12-6 shows the Lorenz Curve for three countries, I, II, and III. Of the three countries shown,
A) Country III has the most unequal income distribution.
B) Country II has the most unequal income distribution.
C) Country I has the most unequal income distribution.
D) Country III has the most equal income distribution.
E) Country II has a more equal income distribution than Country I.
G) B) and E)
Correct Answer

verified
Correct Answer
verified
Multiple Choice
Consider a law that limits women's access to certain "dangerous" occupations like coal mining and military combat service. Such a law would likely reduce women's wages because:
A) women would be overqualified for "non-dangerous" jobs.
B) labor supply in female-intensive occupations would increase.
C) women would be less likely to obtain college degrees.
D) comparable worth would no longer exist between men's and women's occupations.
F) All of the above
Correct Answer

verified
Correct Answer
verified
Multiple Choice
According to the statistics, the distribution of money income:
A) fluctuated widely since 1947.
B) changed significantly in favor of the bottom 5 percent.
C) has not changed greatly since 1947.
D) has not changed greatly since 1929.
F) C) and D)
Correct Answer

verified
Correct Answer
verified
Multiple Choice
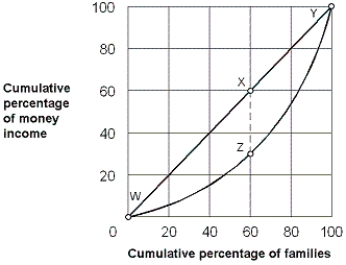
Exhibit 12-3 Lorenz curve for an economy  -According to the Lorenz curve shown in Exhibit 12-3, what percentage of total income is earned by the richest 20 percent of families?
A) 20 percent.
B) 40 percent.
C) 60 percent.
D) 80 percent.
F) None of the above
Correct Answer

verified
Correct Answer
verified
True/False
Wage discrimination means workers with equal productivity are paid unequal wages, or workers with unequal productivity are paid equal wages.
B) False
Correct Answer

verified
Correct Answer
verified
Multiple Choice
The poorest 20 percent of the U.S. population received approximately ____ of total income.
A) 5 percent
B) 10 percent
C) 15 percent
D) 20 percent
F) None of the above
Correct Answer

verified
Correct Answer
verified
Multiple Choice
When the Lorenz curve lies above the diagonal,
A) the poorest 20 percent of the population receive more than 20 percent of income.
B) the richest 20 percent of the population receive more than 20 percent of income.
C) everyone receives the same income.
D) the country's income has been rising over time.
E) it is wrong since it is impossible for the graph to look like this.
G) All of the above
Correct Answer

verified
Correct Answer
verified
Multiple Choice
Which of the following might increase the supply curve of labor?
A) Elimination of discrimination against blacks.
B) Elimination of discrimination against females.
C) Easing licensing requirements.
D) All of these.
F) A) and C)
Correct Answer

verified
Correct Answer
verified
True/False
The distribution of income has become more equal since 1929.
B) False
Correct Answer

verified
Correct Answer
verified
True/False
Food stamps and Medicaid are in-kind transfer programs.
B) False
Correct Answer

verified
Correct Answer
verified
Multiple Choice
Using the Lorenz curve, the degree of income inequality is measured by the:
A) line connecting all points for which a given percentage of families receives exactly that cumulative percentage of income.
B) distance of the Lorenz curve from the line of perfect equality.
C) flat diagonal line that applies to a perfectly elastic demand curve.
D) number of times the Lorenz curve crosses the line of perfect equality.
F) A) and C)
Correct Answer

verified
Correct Answer
verified
Multiple Choice
If official U.S. poverty statistics included in-kind transfer payments the:
A) poverty rate would be close to zero.
B) poverty rate would be lower.
C) government deficit would be lower.
D) top 10 percent of those in the income distribution would be wealthier.
F) A) and C)
Correct Answer

verified
Correct Answer
verified
Multiple Choice
After 1929 in the United States, as measured by the Lorenz curve, income inequality:
A) increased sharply.
B) remain unchanged.
C) declined.
D) increased.
F) A) and C)
Correct Answer

verified
Correct Answer
verified
Multiple Choice
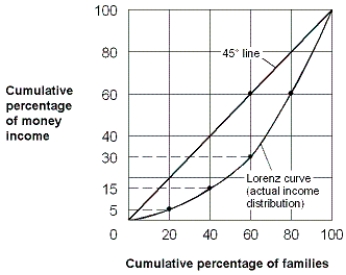
Exhibit 12-4 Lorenz curve  -As shown in Exhibit 12-4, 40 percent of families earned a cumulative share of about ____ percent of income.
A) 5
B) 15
C) 30
D) 50
F) None of the above
Correct Answer

verified
Correct Answer
verified
True/False
The U.S. Lorenz curve today is closer to the perfect equality line than in 1929.
B) False
Correct Answer

verified
Correct Answer
verified
Multiple Choice
Which of the following countries has the most unequal distribution of income?
A) The United States.
B) Czech Republic.
C) Brazil.
D) cannot be determined.
F) A) and B)
Correct Answer

verified
Correct Answer
verified
Showing 101 - 120 of 130
Related Exams