A) interrelationship digraph
B) matrix diagram
C) tree diagram
D) prioritization grid
E) activity network diagram
G) A) and B)
Correct Answer

verified
Correct Answer
verified
Multiple Choice
The first step in creating a ________ is to state the problem clearly in the head of the fish.
A) control chart
B) Pareto chart
C) scatter diagram
D) cause-and-effect diagram
E) histogram
G) All of the above
Correct Answer

verified
Correct Answer
verified
True/False
The Pareto chart is one of the new seven tools for management.
B) False
Correct Answer

verified
Correct Answer
verified
Multiple Choice
________ are data-gathering tools that can be used in forming histograms.
A) Process maps
B) Pareto charts
C) Check sheets
D) Scatter plots
E) Control charts
G) C) and D)
Correct Answer

verified
Correct Answer
verified
Essay
What are Ishikawa's seven basic tools of quality and how should they be used together?
Correct Answer

verified
The basic seven tools of quality are pro...View Answer
Show Answer
Correct Answer
verified
View Answer
Multiple Choice
________ are frequency charts that are aided by the 80/20 rule.
A) Cause-and-effect diagrams
B) Control charts
C) Pareto charts
D) Histograms
E) Scatter diagrams
G) B) and E)
Correct Answer

verified
Correct Answer
verified
Multiple Choice
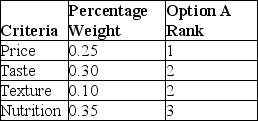
Cletus Inc. plans to overhaul the cafeteria menu and has formed a four-person team to evaluate alternatives. The team identifies four criteria and their corresponding percentage weights. Option A has ranks as shown in the table below:  What is the importance score sum for option A?
A) 1.0
B) 2.1
C) 4.2
D) 8.0
E) 9.6
G) B) and E)
Correct Answer

verified
Correct Answer
verified
Essay
Define a matrix diagram. What are the steps involved in constructing a matrix diagram.
Correct Answer

verified
A matrix diagram is similar in concept t...View Answer
Show Answer
Correct Answer
verified
View Answer
True/False
A control chart is a tool used to brainstorm possible contingencies or problems associated with the implementation of some program or improvement.
B) False
Correct Answer

verified
Correct Answer
verified
Multiple Choice
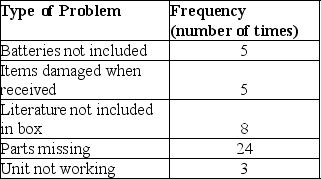
The RC and More Superstore decides to track customer complaints as part of their ongoing customer satisfaction improvement program. After collecting data for two months, their check sheet appears as follows:  If they construct a Pareto chart, how many of these categories are required to make up 53% of all complaints?
A) 1
B) 2
C) 3
D) 4
E) 5
G) All of the above
Correct Answer

verified
Correct Answer
verified
Multiple Choice
Cletus Inc. plans to overhaul the cafeteria menu and has formed a four-person team to evaluate alternatives. The team identifies four criteria and has ranked the Price criteria as shown in the table below:  What is the final price ranking for alternative C?
A) first
B) second
C) third
D) fourth
E) cannot be determined from the information given
G) All of the above
Correct Answer

verified
Correct Answer
verified
True/False
A histogram is a picture of a process.
B) False
Correct Answer

verified
Correct Answer
verified
Multiple Choice
The first step in setting up a ________ is to identify common defects occurring in the process.
A) histogram
B) Pareto chart
C) check sheet
D) control chart
E) process map
G) None of the above
Correct Answer

verified
Correct Answer
verified
Essay
What is an interrelationship digraph and when should it be used?
Correct Answer

verified
An interrelationship digraph is used to ...View Answer
Show Answer
Correct Answer
verified
View Answer
Multiple Choice
Calculate the number of classes if there are 16 observations in a data set.
A) 7
B) 6
C) 5
D) 4
E) 3
G) A) and B)
Correct Answer

verified
Correct Answer
verified
Multiple Choice
Calculate the number of classes if there are 32 observations in a data set.
A) 7
B) 6
C) 5
D) 4
E) 3
G) B) and D)
Correct Answer

verified
Correct Answer
verified
True/False
The root causes of the problems associated with the process are identified using a cause-and-effect diagram.
B) False
Correct Answer

verified
Correct Answer
verified
True/False
The first step in setting up a scatter plot is to determine the independent and dependent variables.
B) False
Correct Answer

verified
Correct Answer
verified
Multiple Choice
The first step in constructing ________ is to gather categorical data relating to quality problems.
A) control charts
B) histograms
C) scatter diagrams
D) Pareto charts
E) cause-and-effect diagrams
G) B) and C)
Correct Answer

verified
Correct Answer
verified
True/False
An affinity diagram creates a hierarchy of ideas on a large surface.
B) False
Correct Answer

verified
Correct Answer
verified
Showing 21 - 40 of 90
Related Exams